There is substantial waste in street lighting today. The transition to LED saved money by providing more lumens per watt, but it didn’t lead to better lighting. Most cities simply swapped fixtures one-for-one without rethinking what the right light is, where it should go, or when it should be on. This series explores the quantifiable financial benefits of getting it right. Utility cost avoidance is the first of seven components we’ll cover. Together, these benefits outweigh the costs by 10x.
Most people think energy savings from dimming streetlights is simple math: fewer watts times your electric rate equals dollars saved. That’s true, but it isn’t where the lion’s share of financial value is created.
Streetlights turn on when the sun goes down. As solar generation drops and demand peaks, the cost of electricity to utilities spikes. In today’s grid, when and where energy is used is more important than how much energy is used.
Using the California Public Utilities Commission’s Avoided Cost Calculator, we calculate $10.18 per light per year in utility system value from optimized dimming. That’s value to the grid and to ratepayers, separate from whatever the streetlight owner saves on their energy bill. Here’s exactly how we get there.
What the ACC Actually Measures
The California Public Utilities Commission maintains the ACC to quantify what utilities avoid spending when customers reduce their electricity consumption. The specific rates and components differ by jurisdiction, but the concept is the same. Unlike a simple rate calculation, these tools bundle together all the costs that utilities would otherwise pass to ratepayers: generation energy (fuel and operating cost), generation capacity (power plant construction and maintenance), transmission and distribution infrastructure, greenhouse gas compliance costs, ancillary services for grid stability, and system losses.
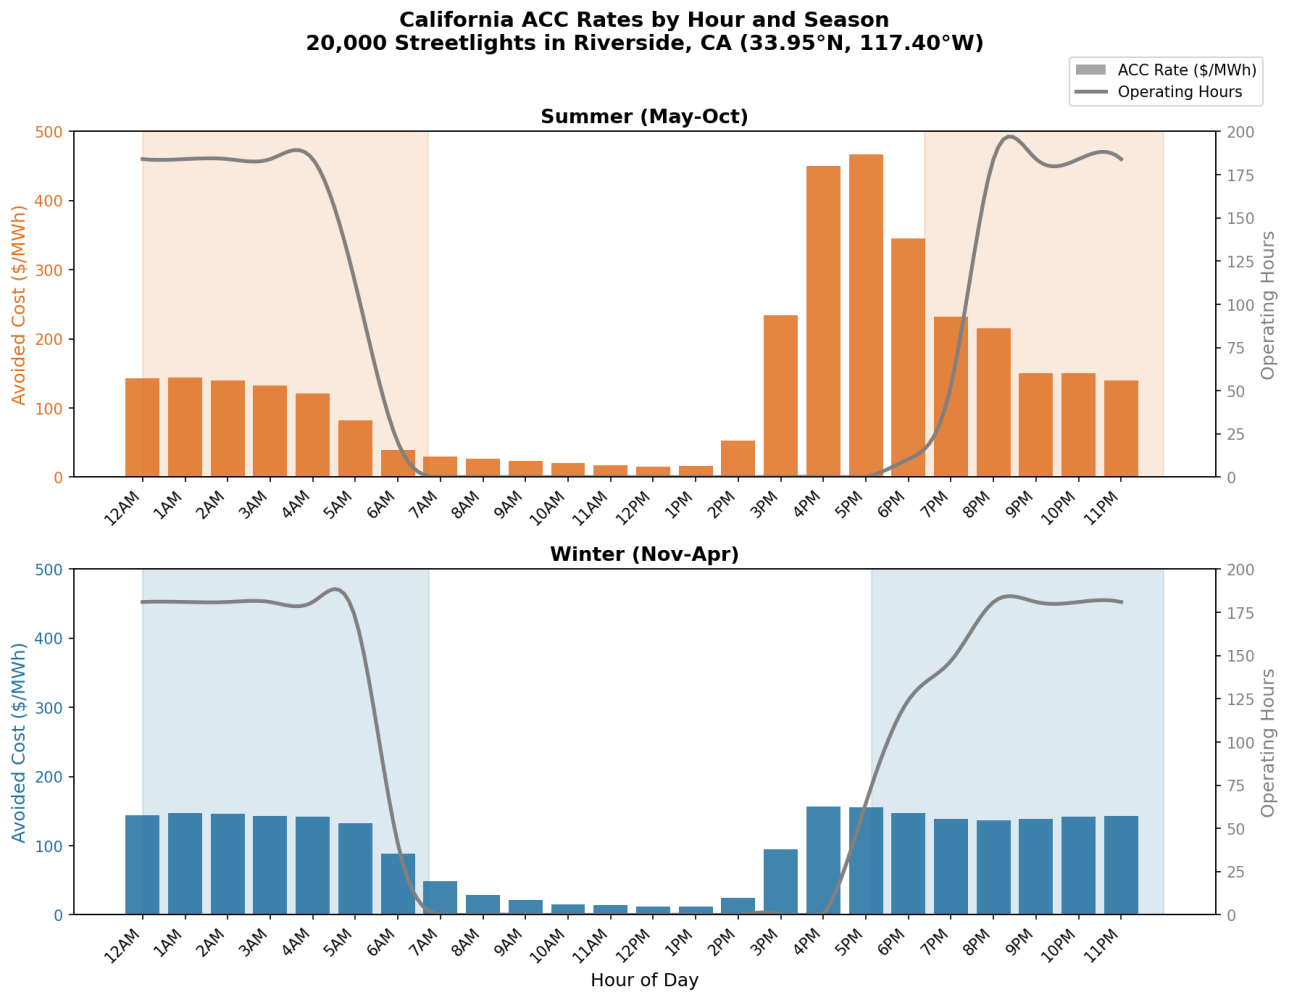
The ACC produces hourly rates that vary by season (winter and summer) and time of day. As the chart below shows, summer afternoon rates can exceed $450/MWh while overnight rates hover around $140/MWh. In California, reducing energy use during the middle of the day doesn’t have many benefits to utilities. This is due to a phenomenon called “the duck curve.” Streetlights are on when it matters most: ACC rates peak in the evening hours when sun goes down and the grid is stressed.
 How 20,000 streetlights generate $203,699 in annual utility cost avoidance.
The Calculation Step by Step
We model a representative fleet of 20,000 streetlights at 50W average, a total connected load of 1 MW. Street lights should turn on at the beginning of nautical dusk and the end of nautical dawn, when the sun is 6 degrees below the horizon after sunset and before sunrise. Determining the exact operating window for every day of the year is not trivial — it shifts with latitude, longitude, and season, and getting it wrong by even 30 minutes changes the avoided cost calculation meaningfully because those edge-of-darkness hours coincide with the highest ACC rates. We use our Twilight Calculator to compute precise nautical dusk and dawn times for the City of Riverside, CA (33.95°N, 117.40°W) in Southern California Edison (SCE) territory. The grey line in the chart above shows these operating hours: full coverage during core nighttime hours, tapering at dusk and dawn as twilight shifts through the seasons.
If streetlights turn on early, especially during summer, they waste energy precisely when the ACC has the highest value and the grid is most unstable. Our $10.18/year calculation assumes lights are already operating correctly, even though we can see with our eyes that they are not. More precise control could bring substantially more value to utilities.
From the ACC model’s detailed output, we extract hourly avoided cost rates for each season. For each operating hour, we apply the appropriate dimming percentage: 25% savings during evening and pre-dawn hours (75% power), 50% savings from 1 AM to 5 AM (50% power). We then multiply by the ACC rate:
Avoided Cost = Fleet MW × Dimming % × Hours × ACC Rate
Summing across all hours and both seasons produces a total annual benefit of $203,699. Divide by 20,000 lights and we get $10.18 per light per year.
Why This Matters
This $10.18 represents value to California utilities and their ratepayers. It’s separate from the direct energy cost savings that accrue to the streetlight owner, and separate from the other municipal benefits of optimized lighting: reduced traffic incidents, crime reduction, extended luminaire life, and lower maintenance costs. When streetlight optimization reduces nighttime baseload, it reduces the need for utility investments in generation and infrastructure. These costs are real and show up in all of our electric bills.
California’s three IOU territories contain an estimated 1.7 million streetlights (based on 2013 CPUC data adjusted for population growth). At $10.18 per light, that’s approximately $17.5M in annual utility cost avoidance. The $10.18/light/year ($17.5M/year across IOU territory) assumes every light turns on and off at exactly the right time. If the average light turns on just 15 minutes early, that’s an additional $0.91/light/year ($1.6M) in annual avoidable utility system costs across California’s IOUs. This number is substantial for just 15 minutes because this is precisely the most challenging time for the electric grid, represented by the highest ACC rates. 15 minutes is conservative. General rule of thumb, if a street light is on before sunset it is at least 25 minutes early. Of course, this doesn’t include electric costs for “day-burners” street lights running all the time. The photo below was taken 27 minutes before the street light should have turned on.
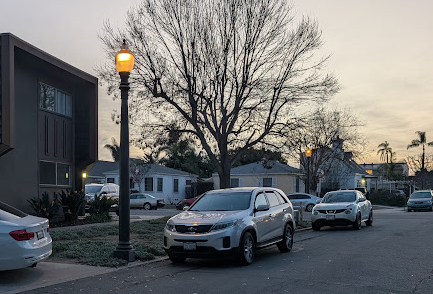 Photo taken 5:09 PM on January 20, 2025 in San Diego. Street lights are on before sunset, 27 minutes before the end of civil twilight.
The Fine Print
The supporting data comes from the CPUC 2024 ACC Electric Model v1b, configured for Climate Zone 10 using the Total Resource Cost test with 20-year levelization, standard settings for utility program evaluation.